Advanced Excel Training
The Advanced Microsoft Excel Training by Internshala Trainings was a 4-week online program that covered Excel comprehensively, from essential spreadsheet operations to advanced data analytics and automation features.
The training combined theoretical understanding with practical assignments, case studies, and one final project to ensure end-to-end mastery of Excel for business and data analysis tasks.
The program provided a strong grasp of data management, visualization, and reporting, strengthening my ability to use Excel effectively for business analytics, audit documentation, and MIS reporting.
Category
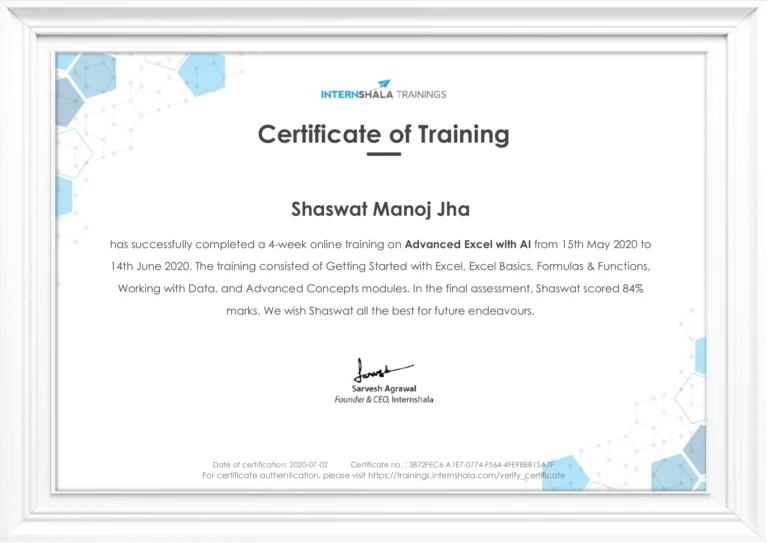
Data Science
Internship At
Internshala Trainings
Course Duration
4 Weeks
Course Dates
15.05.20 – 14.06.20
Final Score
84%
Verification Links
Key Learning Modules
The course progressed from fundamental spreadsheet concepts to complex analytical and reporting techniques, supported by interactive assignments and guided labs.
Getting Started with Excel – Interface overview, worksheets, ribbons, and quick access toolbar.
Keyboard Shortcuts and Navigation – Efficient data entry and cell referencing.
Worksheet & Data Management – Handling multiple sheets, find and replace, and sheet protection.
Formulas and Functions – SUM, AVERAGE, IF, VLOOKUP, HLOOKUP, INDEX-MATCH, and logical formulas.
Data Sorting and Filtering – Managing large datasets and applying advanced filters.
Conditional Formatting – Highlighting key insights dynamically using rules and color scales.
What-If Analysis Tools – Scenario Manager, Goal Seek, and Data Tables for projections.
Pivot Tables & Charts – Summarizing data, creating visual dashboards, and building business insights.
Page Layout & Printing Tools – Formatting for professional reporting.
Final Project
For the final capstone project, I performed an end-to-end business data analysis for a food technology startup, Food2Go.
The objective was to leverage Excel’s analytical and visualization tools to interpret marketing and customer support data and provide actionable insights.
Key Highlights:
Objective: Use Excel to analyze marketing campaign performance, cuisine popularity, and restaurant-level customer support metrics.
Approach: Cleaned, sorted, and visualized structured data using formulas, Pivot Tables, and What-If Analysis.
Outcome: Identified underperforming campaigns, customer satisfaction trends, and improvement areas through an Excel-based dashboard and report.
Deliverable: Submitted a detailed Excel workbook and summarized findings in a structured business analysis report.
Key Learning Outcomes
Built proficiency in Microsoft Excel for business analytics and data interpretation.
Learned to automate and visualize data using advanced functions, Pivot Tables, and conditional formatting.
Strengthened analytical reasoning through real-world datasets and scenario modeling.
Enhanced ability to prepare professional MIS reports and dashboards for business decision-making.
Conclusion
The Advanced Excel Training by Internshala provided essential analytical and visualization skills that remain integral to my daily work in data-driven auditing, report automation, and GRC documentation.
It laid the foundation for using Excel as a powerful tool for business insights, enabling efficient analysis and presentation of complex datasets.